Soft, Real-Time,
Distributed Graph Coloring using Decentralized, Synchronous,
Stochastic,
Iterative-Repair, Anytime Algorithms
A Framework
Kestrel Institute Technical Report KES.U.01.05
May 2001*
Stephen Fitzpatrick & Lambert Meertens
fitzpatrick@kestrel.edu, meertens@kestrel.edu
Kestrel Institute, 3260 Hillview Avenue,
Palo Alto, CA 94304, USA
Project: e-Merge-ANT
http://ants.kestrel.edu/
Abstract
Soft, real-time distributed graph coloring is presented as a simplification of the problem of distributed resource management in an environment where communication is expensive and subject to relatively high latency. The resources are subject to dynamic task sets that may produce critical or super-critical loading – the objective is to quickly compute reasonable schedules for the resources that accomplish a satisfactory fraction of the task set. A class of simple, decentralized, anytime, approximate colorers is presented, together with a framework for assessing performance, and representative results from performance experiments using a simulator.
This work is sponsored in part by DARPA through the "Autonomous Negotiating Teams" program under contract #F30602-00-C-0014, monitored by the Air Force Research Laboratory. The views and conclusions contained in this document are those of the authors and should not be interpreted as representing the official policies, either expressed or implied, of the Defense Advanced Research Projects Agency or the U.S. Government.
Large, distributed resource networks are expected to become commonplace as technology matures for cheap, low-power, software-controlled sensors, effectors, and computational and communication devices. For example, tens of thousands of simple sensor devices may be scattered over geographical regions of interest and the devices networked using low-power, peer-to-peer radio communication.
In some application domains the task load on such resource networks is expected to vary dramatically; for example, a sensor network may transition from a low-load regime in which no targets are being tracked and the sensors merely perform background scans to detect targets, to a high-load regime in which many targets are being tracked. It is expected that the load may become critical (i.e., the task load is such that the resource network must operate with near optimal performance in order to successfully accomplish all of the tasks) or even super-critical (i.e., the task load is too high for all of the tasks to be accomplished).
The performance of the resource network may be gauged differently in the various task load regimes. For example:
when the task load is light, the network may be required to accomplish every task with a high degree of success and to minimize costs; e.g., battery consumption or radio emissions;
when the task load is moderate, the network may be required to accomplish every task with a high degree of success, but cost minimization may be sacrificed;
when the task load is critical or super-critical, the network may only be required to achieve some “reasonable” fraction of its tasks, but it is not acceptable for the network to simply cease to operate.
Note that the tasks which the resource network is to accomplish may be time-sensitive and may require collaboration between multiple resources (for example, a target may need to be observed by multiple sensors simultaneously for accurate tracking; moreover, the particular sensors used to track a given target may vary as the target moves).
The function of a resource allocation algorithm is to manage a resource network to try to achieve some reasonable subset of the specified performance goals, such as those listed above. The requirements on the resource allocation algorithm may be summarized as follows:
The resource network may be arbitrarily large, so the resource allocation algorithm must be scalable.
Resource allocation and task accomplishment are concurrent: the resources are accomplishing tasks even while the allocation algorithm continues to improve their allocation or adapts it to a changing task set. The resource allocation algorithm must be sensitive to the temporal requirements of the tasks.
The resource allocation algorithm must be able to function satisfactorily under dynamically varying task loads.
Resources may fail and recover, and the resource allocation algorithm must be able to continue to function.
These requirements strongly suggest that decentralized, local, anytime algorithms be used for resource allocation:
The algorithm consists of multiple, interacting components, each of which is responsible for some subset of the resource network. In order to achieve scalability, the number of such components is proportional to the size of the network.
Each component of the decentralized algorithm interacts with a limited number of other components. One consequence is that no component has complete knowledge of the network.
The algorithm makes use of whatever time it has available, respecting the temporal requirements of the tasks and the latency of the network, to compute the best allocation of the resources that it can. Moreover, it continues to recompute the allocation as tasks are being accomplished.
It may be expected that under low, stable task loads, the algorithm will, in time, compute a high-quality allocation (although the local nature of the algorithm may prevent it from computing a truly optimal allocation). Under high, dynamic task loads, the allocation may be only a “best effort”, but an allocation will still be produced soon enough to accomplish some of the tasks; this outcome is considered preferable to the algorithm computing an optimal allocation, but doing so too late for any of the tasks to be accomplished.
The preceding sections discussed distributed resource allocation in general terms. A specific application would presumably define concrete characteristics and metrics (for such terms as the temporal requirements of a task, network latency, and quality of task accomplishment) that would provide a concrete framework in which a resource allocation algorithm could optimize its performance.
However, this report will not delve into the specifics of any particular application. Rather, it introduces an abstraction/simplification in the form of distributed, anytime graph coloring:
The vertices of the graph that is being colored correspond to the resources that are being allocated.
The edges of the graph correspond to the constraints between resources. In this abstraction, the constraints can only be mutual exclusion constraints; that is, two vertices connected by an edge correspond to two resources that cannot be activated simultaneously.
The vertices of the graph are assigned “colors” which correspond to time slots in a cyclic schedule for resource activation.
The number of colors corresponds to the length of the schedule's cycle. In this report, the number of colors is predetermined; this corresponds to the length of a schedule being limited by, for example, the need to scan every region sufficiently frequently to ensure that targets are detected sufficiently quickly.
The graph coloring algorithm corresponds to the resource allocation algorithm. Its objective is to try to assign every vertex a color in such a way that if an edge exists between two vertices, then they have different colors (since the colors correspond to activation times and the edges correspond to mutual exclusion constraints).
The coloring is distributed in that knowledge of the vertices’ colors and responsibility for assigning colors is distributed among numerous “agents”. The agents interact to try to produce a high-quality coloring; that is, one in which most edges satisfy the constraint that the vertices they connect have different colors.
In this abstraction, as presented in this report, tasks are not explicit. Rather, it is assumed that every vertex must be colored; this corresponds to every resource being activated in a resource network. The difficulty of a coloring is determined by the number of colors used versus the graph’s chromatic number (the smallest number of colors which can be used to produce a coloring in which no edge connects vertices of the same color). This roughly corresponds to the task load versus the resource work rate in a resource allocation application.
The graph coloring algorithm is subject to the same requirements as the resource allocation algorithm: it must be scalable, real-time, adaptive and robust. Details of how the satisfaction of these requirements can be formally assessed are presented below; for now, it is sufficient to note that this report considers only anytime graph coloring algorithms, which incrementally improve colorings over time.
The objective of this report is to introduce the concepts and notation of soft graph coloring and a class of decentralized, iterative-repair, anytime graph colorers, together with a framework in which the colorers can be assessed. This report includes specific results for particular colorers and graphs, but these are intended only as examples: a comprehensive assessment of various colorers over a wide range of graphs will be presented in subsequent reports.
The following sections formally define the concept of soft graph coloring, including a metric on the quality of colorings; then a general algorithm scheme is defined for local, decentralized iterative repair coloring; a communication cost metric on coloring is defined; and the results of performance experiments on a simulator are presented.
In standard graph coloring, the objective is to produce a proper vertex coloring; i.e., an assignment of a color to each vertex of an undirected graph such that no edge in the graph connects vertices of the same color:
![]() (proper vertex coloring of G)
(proper vertex coloring of G)
where {u,v} denotes an undirected edge between vertices u and v, EG denotes the set of edges of graph G, and cv denotes the color of vertex v.
In many problems, it is also required that the number of colors be minimized. The fewest colors needed to properly color a given graph is called the graph’s chromatic number and is denoted by cG.
An edge is said to be a conflict if it connects two vertices that have the same color: a proper coloring contains zero conflicts. For the types of problems outlined in the introduction, it is more important to quickly and efficiently reduce the conflicts to an acceptable level, than to achieve a proper coloring. To this end, define the unnormalized degree of conflict as the total weight of edges that are conflicts divided by the total weight of all edges:
 (unnormalized degree of conflict)
where w{u,v} is the weight (a non-negative real number) of edge {u,v}.1
The unnormalized degree of conflict has range [0,1]. It may be taken to define the quality of a coloring as follows: a proper coloring has degree of conflict 0; a single-color coloring, in which every vertex has the same color, has degree of conflict 1. Thus, a low value of g indicates a high-quality coloring, while a high value of g indicates a low-quality coloring. The objective of (soft) colorers is to quickly minimize the degree of conflict.
This report considers graph coloring with a fixed number of colors2, which may be less than, equal to, or greater than the chromatic number of the graph that is to be colored – the degree of conflict is well-defined in any case.
A random coloring (i.e., a coloring in which each vertex is randomly assigned a color) that uses C colors has an expected degree of conflict of 1/C. This value can be used as a baseline for assessing non-random colorers: since a random coloring can be produced in a distributed system using no communication, any colorer that does incur communication costs had better produce better-than-random colorers.
As the above paragraph illustrates, coloring with a high number of colors is essentially easier than coloring with a low number of colors: even a random coloring algorithm can produce arbitrarily low values of the degree of conflict, if the number of colors is high enough. The inherent effect of the number of colors can be partially eliminated by scaling the degree of conflict by the number of colors to give the normalized degree of conflict G:
![]() (normalized
degree of conflict)
(normalized
degree of conflict)
This metric simplifies the assessment of the performance of a given coloring using different numbers of colors. For example, using the normalized metric, a random coloring has an expected score of 1, regardless of the number of colors. The unqualified term “degree of conflict” will generally refer to the normalized metric.
The graph colorers that are considered in this report are decentralized, local, iterative-repair colorers: each vertex is responsible for assigning its own color and, after randomly choosing an initial color, it repeatedly chooses a color that minimizes the number of conflicts its has with its neighbors, based on what it knows of its neighbors' colors when it makes its choice.
The colorers considered here are synchronous3: each vertex simultaneously determines if it should activate; each vertex that does activate, simultaneously chooses a color for itself; then each vertex that changed color, simultaneously communicates its new color to its neighbors.
A vertex’s decision to activate is probabilistic: each vertex determines an activation probability, generates a random number (in the range [0,1]), and activates if the random number falls below its activation probability. The method for determining the activation probability can significantly affect the performance of the colorer. Indeed, various families of colorers can be defined based on different methods for determining the activation probability. For example, a particularly simple family is that of the Fixed Probability Colorers: FP(p), where 0£p£1, denotes the colorer in which each vertex’s activation probability is the constant p.
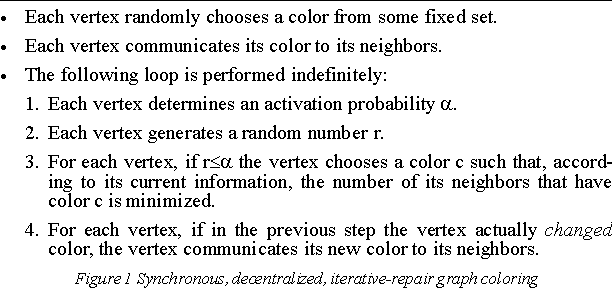
A summary of the synchronous coloring algorithm is shown in Figure 1.
In a decentralized graph colorer, it is possible for two neighbors (i.e., two vertices that are connected by an edge) to change color simultaneously, in which case each of the neighbors chooses its color based on out-of-date information; consequently, the color chosen may not be optimal. For example, consider the following step in the coloring of a 2-vertex graph, using 2 colors:
![]()
If each vertex (on the left) activates, then each will independently determine that its optimal color is green, since its only neighbor is red. This is an example of the well-known problem of coherence in distributed systems (it arises, for example, in distributed cache mechanisms). For decentralized graph coloring, what must be ensured is that neighbors are unlikely to change color simultaneously, on average. The algorithm is generally robust enough to tolerate some degree of simultaneous change, but at sufficiently high levels, the conflicts introduced by neighbors simultaneously changing color outweigh the conflicts resolved.
The probability that two neighbors change color simultaneously could be reduced to zero by, for example, imposing a total order on the vertices and iterating over the vertices sequentially (a vertex’s activation probability would be 1 when its “turn” comes round, and 0 otherwise). However, that is not a scalable solution since only one vertex at a time would be active (and the rate at which conflicts are resolved would be low).
Thus, there is a need to balance parallel activity (having lots of vertices trying to resolve conflicts at each step) against the danger of simultaneous change by neighbors. For the Fixed Probability colorers, this balance can be shifted by adjusting the uniform activation probability: the more likely it is that a vertex will activate, the more likely it is that neighbors will change color simultaneously.
This is illustrated in Figure 2. Each solid curve shows how well FP colored a fixed graph for various activation probabilities. (The graph has chromatic number 4 and 4 colors were used in the colorings.) The data were obtained by measuring the degree of conflict after each step in a run of 1000 steps (and averaging over several such runs). The dashed line shows the expected value for a random coloring.
Note that for FP(0.9), the colorer performs worse than a random colorer, whereas for smaller values of the activation probability, the colorer fairly quickly converges to a high-quality coloring. The minimum activation probability at which FP performs worse than random may be much lower than 0.9 for more complex graphs.
Also note that, even for low activation probabilities, the colorer does not achieve a proper coloring even though the number of colors is as large as the chromatic number. This is typical behavior – it is difficult for a purely local algorithm to achieve a proper coloring, which may require non-local coordination between vertices.
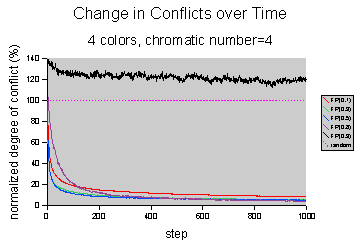
Figure 2 Effect of activation probability on convergence
It should be emphasized that the degree of conflict is measure by instrumentation that is separate from, and unavailable to, the coloring algorithm: the degree of conflict is a global metric and thus is not suitable for incorporation into a local, decentralized algorithm.
The degree of conflict measures the quality of a coloring. For a decentralized colorer, the cost of achieving a coloring is primarily concerned with the amount of communication for two reasons: (i) the communication latency is often the dominating factor in the absolute speed of the colorer; (ii) radio communication is considered a risk because it helps adversaries to locate sensors, for example.
Communication cost could be measured as the number of messages sent. However, coloring graphs of high degree would then be expected to incur higher costs than coloring graphs of low degree, since each time a vertex changes color, it sends a message to each of its neighbors.
Instead, the communication cost is measured in terms of the number of color changes: this can be viewed as the a normalized form of the message-based costs, where normalization has accounted for the graph’s topology. For a single step in the coloring of a graph G, the transition rate is defined as the fraction of vertices whose color changes:
 (transition
rate)
where cv,i is the color of vertex v at step i. Given that a vertex’s color can change at most once per step, the transition rate has range [0,1], where low values indicate low communication costs.
In this section, various classes of performance experiments are discussed and typical results are presented. This is not intended to be a comprehensive analysis/comparison of the algorithms. Rather, it is intended to be an introduction to the sorts of results that are of interest: thorough analyses will be presented in subsequent reports.
Only two families of decentralized, iterative-repair colorers are considered: the Fixed Probability family (FP) and the Conservative Fixed Probability family (CFP). FP was introduced above: every vertex has the same, constant activation probability. CFP is a variant of FP: it differs from FP in that only those vertices that have at least one conflict with a neighbor are eligible for activation; it is similar to FP in that those vertices that do have at least one conflict set a fixed, uniform activation probability.
The performance experiments fall into four classes:
the effect of graph size on colorer performance and cost.
whether or not a colorer converges, and, if it does, the quality of the coloring.
how well a colorer can reduce conflicts over a comparatively short period.
the effect of unreliable communication and a dynamic topology on a colorer.
A decentralized graph coloring algorithm may be said to be scalable if the maximum per-vertex costs are independent of the number of vertices. There is a tacit assumption that the mean degree of the graph is bounded; i.e., that the number of edges per vertex does not grow significantly as the number of vertices grows. This is a reasonable assumption: there are certainly well-known classes of graph which violate this assumption (e.g., the complete graphs) but such topologies are unlikely to arise in the sort of resource network considered in this report because then the network technology itself would likely not be scalable.
The general algorithm scheme for decentralized, local, iterative repair colorers is given in Figure 1. Its costs are as follows:
Step 1, determining an activation level, is undefined in that schema. However, for the FP algorithm, this step clearly has a constant computational and storage cost per vertex, and zero communication costs. For the CFP algorithm, determining if a vertex has a conflict with any neighbor has computational, storage and communication costs that are proportional to the vertex’s degree.4 Averaged over the graph, it may be expected that the per vertex costs are proportional to the mean degree of the graph.5 In any case, the costs are not dependent on the number of vertices. In general, any method for determining an activation level that uses only neighbor-to-neighbor information should have constant per-vertex costs.
Step 2, generating a random number: constant per-vertex costs.
Step 3, choosing an optimal color: for a given vertex, this computation has costs proportional to the number of neighbors (and number of colors). Averaged over the graph, the per-vertex costs are dependent on the mean degree of the graph but independent of the number of vertices.
Step 4, communicating color changes to neighbors: communication costs per vertex are proportional to the mean degree of the graph and independent of the number of vertices.
In summary, the maximum per-vertex computational, storage and communication costs for each coloring step depend on the mean degree of the graph rather than on the size of the graph. Moreover, experimental results support an additional assertion, about the performance of the colorers rather than their costs: for large graphs, the performance of the colorers is not dependent on the size of the graph.
For example, Figure 3 shows the results of coloring six graphs of similar structure and of sizes varying from 500 to 5000 vertices using the FP(0.3) colorer with 2, 3, 4 and 5 colors. For each number of colors, the results for the different graphs show little dependence on the graph's size.
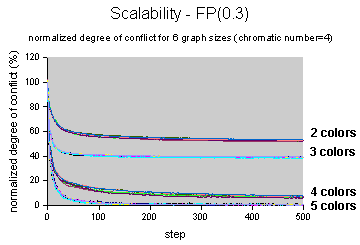
Figure 3 Performance of FP colorer is not dependent on graph size
In light of the size-independence of the colorers, the results of the remaining experiments are presented as averages over multiple graphs of different sizes (and also over multiple runs per graph).
As discussed previously, the FP algorithm may or may not converge to a high-quality coloring, depending on the activation probability. Figure 4 (left) summarizes the long-term performance of FP: each curve shows the degree of conflict achieved by FP, averaged over steps 950 to 1000, for a fixed activation probability and for various number of colors. Figure 4 (right) shows the corresponding communication costs.
The following observations may be made:
For high activation probabilities, the quality of the colorings is uniformly poor, and is often worse than random. Moreover, the transition rate is high, showing that the coloring is unstable (the colorer is said to be thrashing – i.e., constantly changing each vertex’s color without improving the quality of the coloring).
When the number of colors used for a coloring is less than the chromatic number (4) the coloring is said to be over-constrained. It is impossible to reduce the degree of conflict to zero in over-constrained colorings. Nevertheless, for moderate activation levels, FP manages to reduce the degree of conflict significantly below random (i.e., below 100%). Moreover, the communication costs are low, indicating that the coloring is fairly stable (if many vertices were changing color, the communication costs would be high).
When the number of colors is equal to the chromatic number, the coloring is said to be critically constrained. Theoretically, a colorer could reduce the degree of conflict to zero; however, a local algorithm is unlikely to achieve this. For moderate activation probabilities (and for this class of graph) FP manages to reduce the normalized degree of conflict to around 5%; thus, only about 1.25% of the edges are conflicts.
When the number of colors is slightly higher than the chromatic number, the coloring is said to be under-constrained. For moderate activation probabilities (and for this class of graph), FP manages to reduce the degree of conflict to a few percent.
When the number of colors is significantly greater than the chromatic number, the coloring is said to be loosely constrained. Such colorings are inherently easier than colorings with fewer colors, yet FP’s performance is significantly worse and its costs higher. When the number of colors is very high, the normalized degree of conflict and the transition rate become approximately constant.
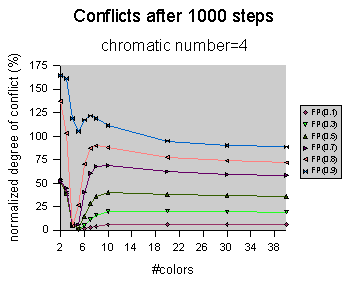
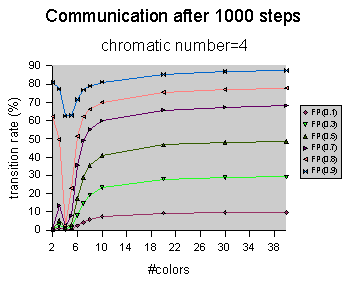
Figure 4 Long-term performance and cost of FP colorer
FP’s counter-intuitive performance for loosely constrained colorings can be explained as follows:
When the number of colors is much higher than the chromatic number, a large number of colors will not occur in a given vertex’s neighborhood at a given coloring step.
Thus, the number of optimal colors available to a given vertex at each coloring step will be high. The colorer chooses randomly from among the optimal colors.
So the colorer behaves, in part, like a random colorer that has C-d colors, where C is the actual number of colors and d is a small reduction that accounts for the number of colors used, on average, in a neighborhood. (Experiments suggest that d is approximately equal to the chromatic number.)
Thus, the dependence of the unnormalized degree of conflict on C should be of the form gµ1/(C-d) and the normalized degree of conflict should be approximately independent of C: GµC/(C-d).
Probability analysis predicts that the dependence of the degree of conflict on the activation probability a should be of the form Gµa/(2-a).
These forms agree well with the experimental data.
FP’s communication costs for loosely coupled colorings are readily explained: since each vertex is almost certain to change color every time it activates, the transition rate should be approximately equal to the activation probability. This also agrees well with the experimental data.
Figure 5 shows the performance of the Conservative Fixed Probability colorer. For over-, critically, and under-constrained colorings, the performance and costs are similar to those of FP. However, for loosely constrained constrained colorings, the performance is dramatically better: the degree of conflict and communication costs reduce to zero.
Clearly, the additional constraint of a vertex activating only when it has a conflict is successful at eliminating FP's quasi-random behavior when the colorer is loosely constrained. However, it is not clear a priori that such a constraint should always be applied: when a coloring is critically constrained, the constraint may prevent a vertex from making a color choice that is essential to achieving a high-quality coloring.
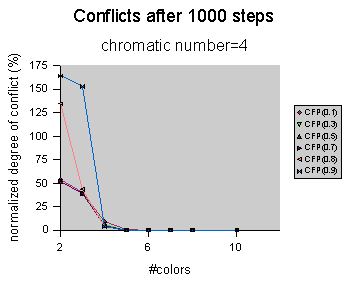
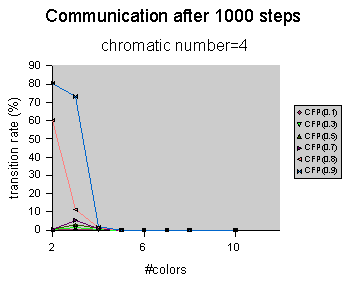
Figure 5 Long-term performance and cost of CFP colorer
In an application involving a resource network, the resource management proceeds concurrently with the accomplishment of the application’s tasks. Thus, it is desirable not only that the resource management algorithm resolve the conflicts (since they directly degrade the application’s performance) but also that it resolve the conflicts quickly.
For example, a resource management algorithm that steadily reduces the number of conflicts to ten percent over one minute may be considered preferable to one that performs only slight reduction for forty seconds, but then quickly reduces the number of conflicts to 0. The precise trade-off between speed and eventual degree of conflict should be defined by a particular application.
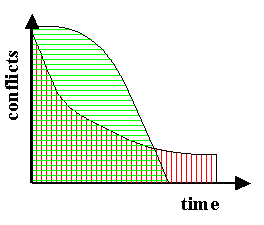
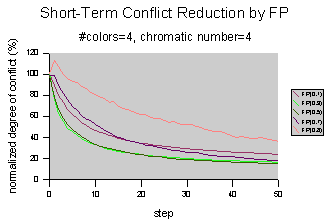
Figure 6 Short-term performance
For this report, it is assumed that what is important is the product of the number of conflicts and the time for which they are endured, or equivalently, the mean of the conflicts over time. Thus, if the performance of a colorer is displayed as a plot of conflicts versus time, the appropriate gauge of performance is the area of the plot (or the mean height). For example, in Figure 6 (left), the red area (vertical stripes) represents better performance than the green area (horizontal stripes). Figure 7 summarizes the short term performance and costs of CFP for various activation probabilities and numbers of colors.
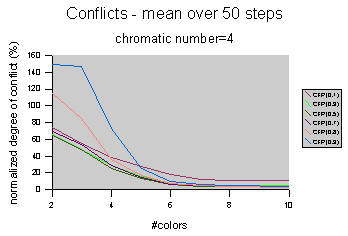

Figure 7 Short-term performance and cost of CFP
To assess the effect of unreliable communication on the colorer, each color-change message sent between neighbors is subjected to a probabilistic process that may either randomize the color information (with probability r) or discard the message altogether (with probability d) – Figure 8 presents this process as pseudo-code.
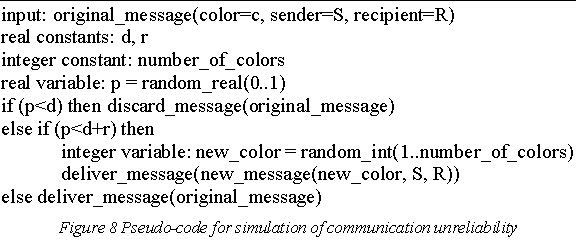
Figure 9 shows typical results. The left diagram shows the effect of increasing r (with d=0); the right diagram shows the effect of increasing d (with r=0). These results indicate that small levels of unreliability cause small, proportional degradations in the performance of the colorer. Higher levels of unreliability naturally cause worse degradation, but even at high levels (e.g., 50% unreliability) the colorer does not suffer catastrophic failure.
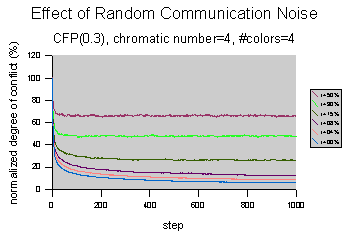
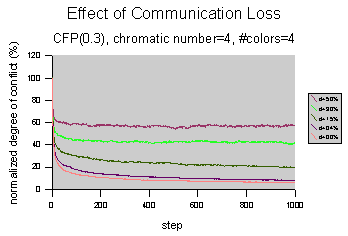
Figure 9 Effect of communication unreliability on CFP(0.3)
A dynamic graph topology, in which vertices and their incident edges are inserted and removed over time, can be used to partially model dynamic resource availability. The model is partial because it only reflects the need to accommodate the changing set of resource constraints – it does not reflect the need to reassign tasks that had previously been assigned to resources that have failed.
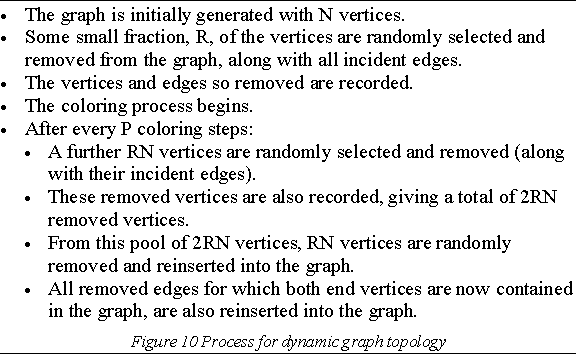
The process for changing the topology is presented in Figure 10. This process is designed to approximately preserve the structure of the graph; in particular, not changing the chromatic number of the graph being colored should simplify analysis of experimental data. The process has two parameters which control how frequently the topology is changed (every P steps) and to what extent (R% of the initial number of vertices).
Figure 11 (left) shows typical effects of changing the topology slightly after every coloring step – there is little change.
Figure 11 (right) shows typical effects of changing the topology significantly but intermittently – after each change, the degree of conflict increases (immediately) but quickly drops again. Overall, the colorer still manages to converge. It is to be expected that there be a limit to the colorer’s ability to adapt to high-levels of change: for example, if such change occurs too frequently.
The results of these experiments suggest that the CFP colorer is quite robust against changes in topology.
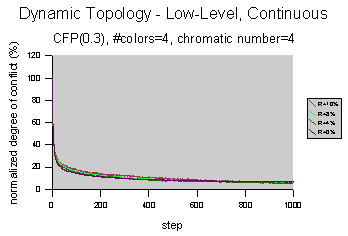
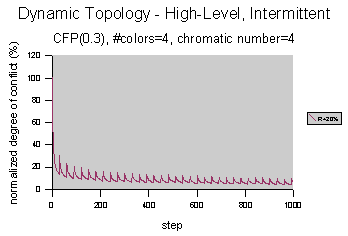
Figure 11 Effect of dynamic topology on CFP
The Fixed Probability algorithm was first published by Fabiunke [Fabiunke1999] in the context of general distributed constraint satisfaction – that paper did not consider over-constrained systems, nor did it consider robustness.
Yokoo at al. have published several algorithms for distributed constraint satisfaction [Yokoo1998]. They are concerned primarily with complete algorithms (i.e., algorithms guaranteed to find a feasible solution when one exists, and to terminate if one does not exist) and thus their algorithms are considerably more complex and incur considerable overheads to track the search space.
Lemaitre and Verfaillie [Lemaitre1997] consider soft constraint optimization in a distributed setting, but their algorithm uses a central coordinating agent and is thus sequential and unscalable. They do suggest that their algorithm can be parallelized, but do not consider details.
This report presents a soft version of graph coloring that is based upon constraint “optimization” rather than hard constraint satisfaction. Soft graph colorers are required to quickly and robustly reduce constraint violations to acceptable levels without incurring high communication costs.
This report presents a family of scalable, decentralized soft graph colorers that are based on probabilistic, synchronized, local, iterative-repair, anytime techniques. This report defines what it means for the colorers to be under-constrained, critically constrained and over-constrained in terms of the number of colors used in a coloring versus the chromatic number of the graph being colorer. It also outlines a series of experiments that investigate the short-term performance of the colorers, their long-term convergence, and their scalability and robustness.
[Fabiunke1999] "Parallel Distributed Constraint Satisfaction", Marko Fabiunke, Proceedings of the International Conference on Parallel and Distributed Processing Techniques and Applications (PDPTA’99), pp 1585–1591, Las Vegas, June 1999
[Lemaitre1997] "An Incomplete Method for Solving Distributed Valued Constraint Satisfaction Problems", Michel Lemaitre & Gerard Verfaillie, AAAI-97, Workshop on Constraints and Agents, Providence, Rhode Island, USA, July 1997
[Yokoo1998] "The Distributed Constraint Satisfaction Problem: Formalization and Algorithms", Makoto Yokoo, Edmund H. Durfee, Toru Ishida & Kazuhiro Kuwabara, IEEE trans. on Knowledge and Data Engineering, vol. 10, no. 5, September/October 1998
*The "Related Work" section was added in June 2001.
1For unweighted graphs, each edge weight may be taken to be 1 so that the degree of conflict corresponds to the number of conflicts divided by the number of edges.
2Coloring using a fixed set of colors may be viewed as an abstraction of problems where a fixed number of indivisible, exclusive resources are to be allocated; for example, registers in a CPU or time slots in a cyclic schedule. The important problem of minimizing the number of colors will be addressed in other reports.
3Asynchronous colorers will be considered in other reports: much of what is reported here carries over to asynchronous colorers.
4This computation can be performed as a cheap addendum to the computations of step 3, so these costs can actually be subsumed into that step.
5This assumes that the vertices change color with an approximately uniform frequency.